
We have all seen the famous XKCD graphic depicting what is worth optimizing and how much time we should sacrifice for it.
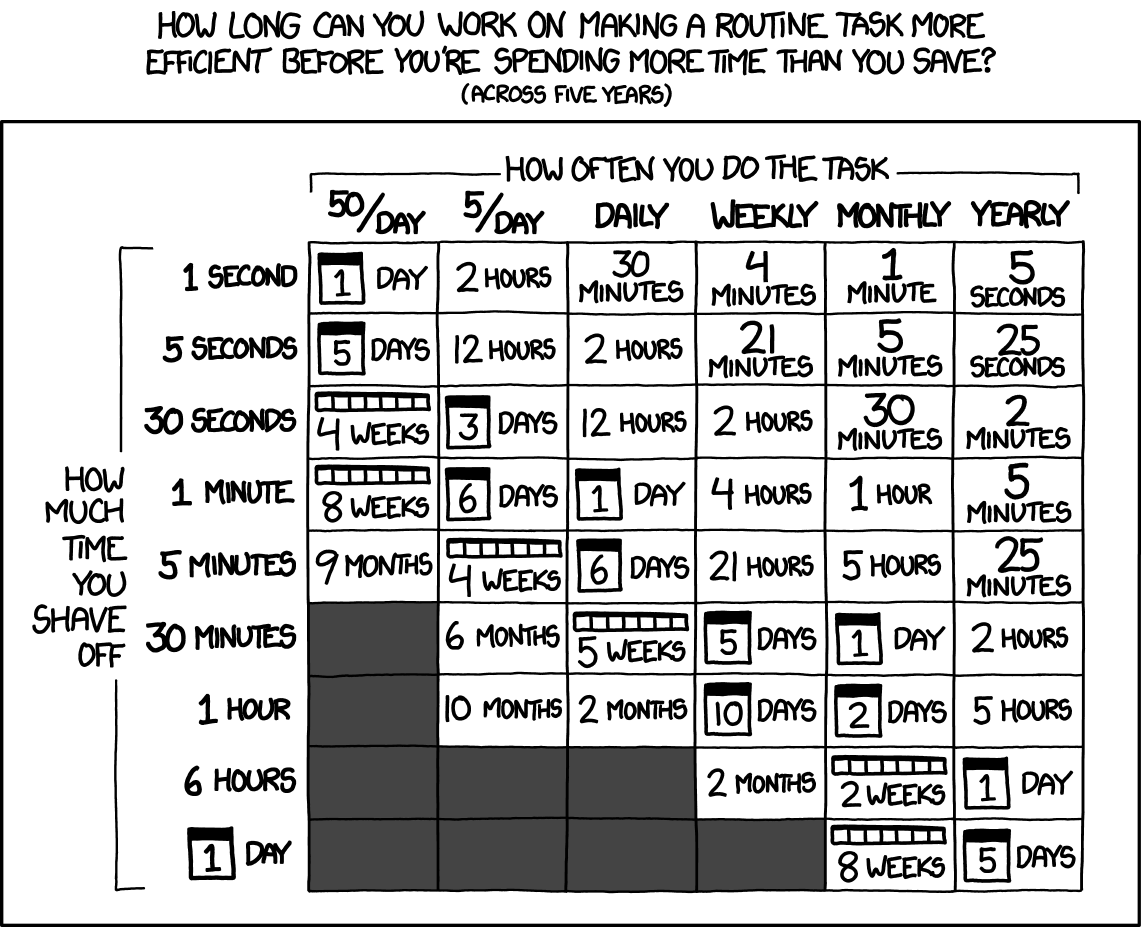
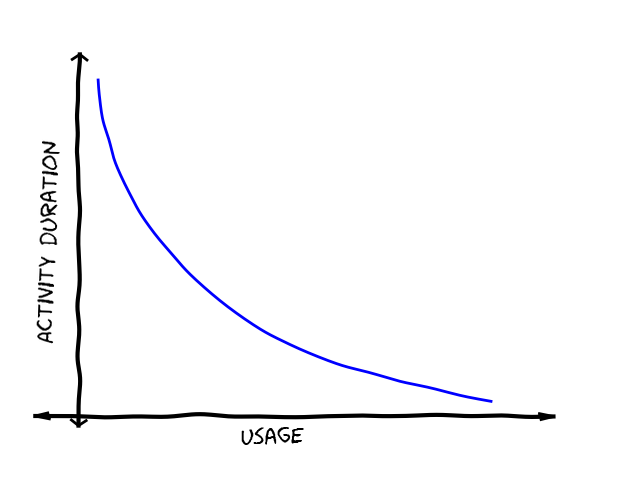
I love this image. It gives you a perspective on how much time you should spend optimizing your tools and processes. However, it does not display a notable conjecture that I made recently: when you decrease the activity duration, you will likely affect its usage in the future.
I have found a connection here with the Law of demand: as the price of a good decreases, the quantity demanded will increase. The price of a good relates to the activity duration and the quantity demanded relates to the number of repetitions you will do (or usage) because when something is easy to do, you're likely to do it more often.
I will illustrate this with an example. First, I want to introduce aiomanhole: a tiny library that allows us to connect to existing running applications and perform introspection, debugging, and even adjustment of running production code. This little library has saved us many times.
Among other things, aiomanhole allows us to connect to a running application and profile it using cProfile. The necessary steps are:
1. Connect to the open aiomanhole port (suppose we have it forwarded to localhost). We use nc to connect to the port and rlwrap to give it a more shell-like feeling:
$ rlwrap nc localhost 9999
2. Run the profiler as described in cProfile.Profile documentation:
>>> import cProfile
>>> pr = cProfile.Profile()
>>> pr.enable()
3. Perform some operation or just wait to ingest data. When it is done, stop the profiler and save it to a file:
>>> pr.disable()
>>> pr.dump_stats('/tmp/production.prof')
4. Gather the file for further analysis. We use Kubernetes, which requires the following:
$ kubectl cp -n namespace_name pod_name:/tmp/production.prof .
Those 4 steps can be done within a minute or less, but demand some time and some mental energy (remembering the exact process, naming the file, etc). We used this process in the past, but sometimes failed to catch the examined situation because we were too slow. Sometimes, we even caught ourselves prioritizing something else over this valuable activity, just because of the time needed to perform the 4 steps.
Then Vita, our CTO, wrote a simple script that wrapped this all together. To capture the profile, now we only need to run:
$ ./profile_running_instance.py <instance_identification> <duration>
This little script does the same as those 4 steps, and also names the profile file with useful information. Since implementing this, I have observed a substantial increase in the number of our captured profiles which aids us in our understanding of the platform and our optimization efforts. It's just so easy that it is often our immediate reaction when something unexpected happens.
This experience taught me that improving often-used tools (or tools which should be used often) not only saves time (duration_before - duration_after) * usage_before but opens possibilities to repeat the action more frequently. I have seen it over and over: improving your tools brings a great multiplicative effect to your productivity.