
This article is a more advanced continuation of How to avoid overfitting trading strategies, you may want to read it first or reference it for definitions.
At Quantlane, we train machine learning (ML) models on trading data which are known to be very noisy. In this haystack we are looking for tiny needles, alpha signals, that can be used as a base for successful trading strategies, which can be automated algorithmic trading or manual execution by our traders. For this task, we need to balance our models on the thin line between underfitting and overfitting the data. In this article, we will discuss some of the tools we use, the tradeoffs and disadvantages they bring, and some techniques to improve model performance even without risking under- or overfit.
Deep versus "shallow" learning
The classical machine learning approach requires us to pre-process data and create 'features', which are transformed data that correspond with predicted labels as directly as possible. Then, even a simple model can make some baseline predictions. The disadvantage of this approach is that if you choose the wrong features or don't understand the modelled process well, you limit the performance of the model.
The recently popular deep learning philosophy contradicts this approach. Deep learning tries to fit a very complex model on vast amounts of raw data. This model is expected to learn the features on its own. This is useful when we have lots of data and little understanding of what features might be useful for the model. Gathering the data becomes complex, for example, when the modelled process changes over time.
In trading, the classical approach is often more practical. We often have a good idea of the process we want to model and features that are useful, perhaps even for us humans. Then, we can create a simple model that can be trained on smaller amounts of more recent data, which further improves the fit quality of the model. It is also simpler to re-fit the model after we believe the modelled process has changed, which can happen often in our fast-paced world. I call this approach "shallow learning" :).
Regularization
Except for feature engineering and tuning model architecture, there are two popular ways to reduce overfitting: regularization and adding more data.
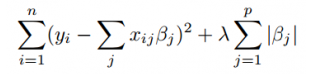
Regularization is a set of techniques that reduce model complexity usually by adding regularization terms to the fitting error function, which grow with some model complexity metric. A basic example of regularization is L1 or L2 regularization. L1 regularization, for example, increases error linearly with the sum of model weights. For a linear regression fitted using the residual sum of squares algorithm, the error function would be the following:
Regularization allows the optimization process the possibility of using a more complex model, if the complexity helps reduce the error. But it also forces the optimization to settle for a reasonably simple model, when additional complexity doesn't reduce the error. Regularization leads to worse fit on training data and, when set correctly, to better fit on out-of-sample data, and therefore better generalization ability of the model.
On the other hand, using regularization means introducing more hyperparameters to the fitting process that have to be tuned or optimized automatically.
The most commonly used regularization methods are L1 and L2 regularization of model weights, or dropout layers for neural networks.
Adding more data
Another way to prevent overfitting is to add more data, and therefore reduce the ratio of model complexity to amount of data. As additional data can be hard to obtain, ML practitioners often use a technique called data augmentation to generate new slightly different data samples from the available data. This is possible when we have a good understanding of how the data should look, which allows us to generate realistic data samples. A typical example is fitting a visual object recognition model on images where only a fraction of the object is visible. Those data can be simply generated from the existing image dataset by cropping the images.